Analytics
The Analytics tab counts the customers who finished a quiz and shows which result they were given, over a period you choose. By the end of this page you can read every figure it holds and know exactly what each one counts.
Before you start
- A quiz open in the editor.
- At least one finished response, since every figure on the tab comes from customers who reached the result screen.
Open the tab
- Open the quiz from the app home.
- Select Analytics in the row of tabs at the top, between Design and Responses.
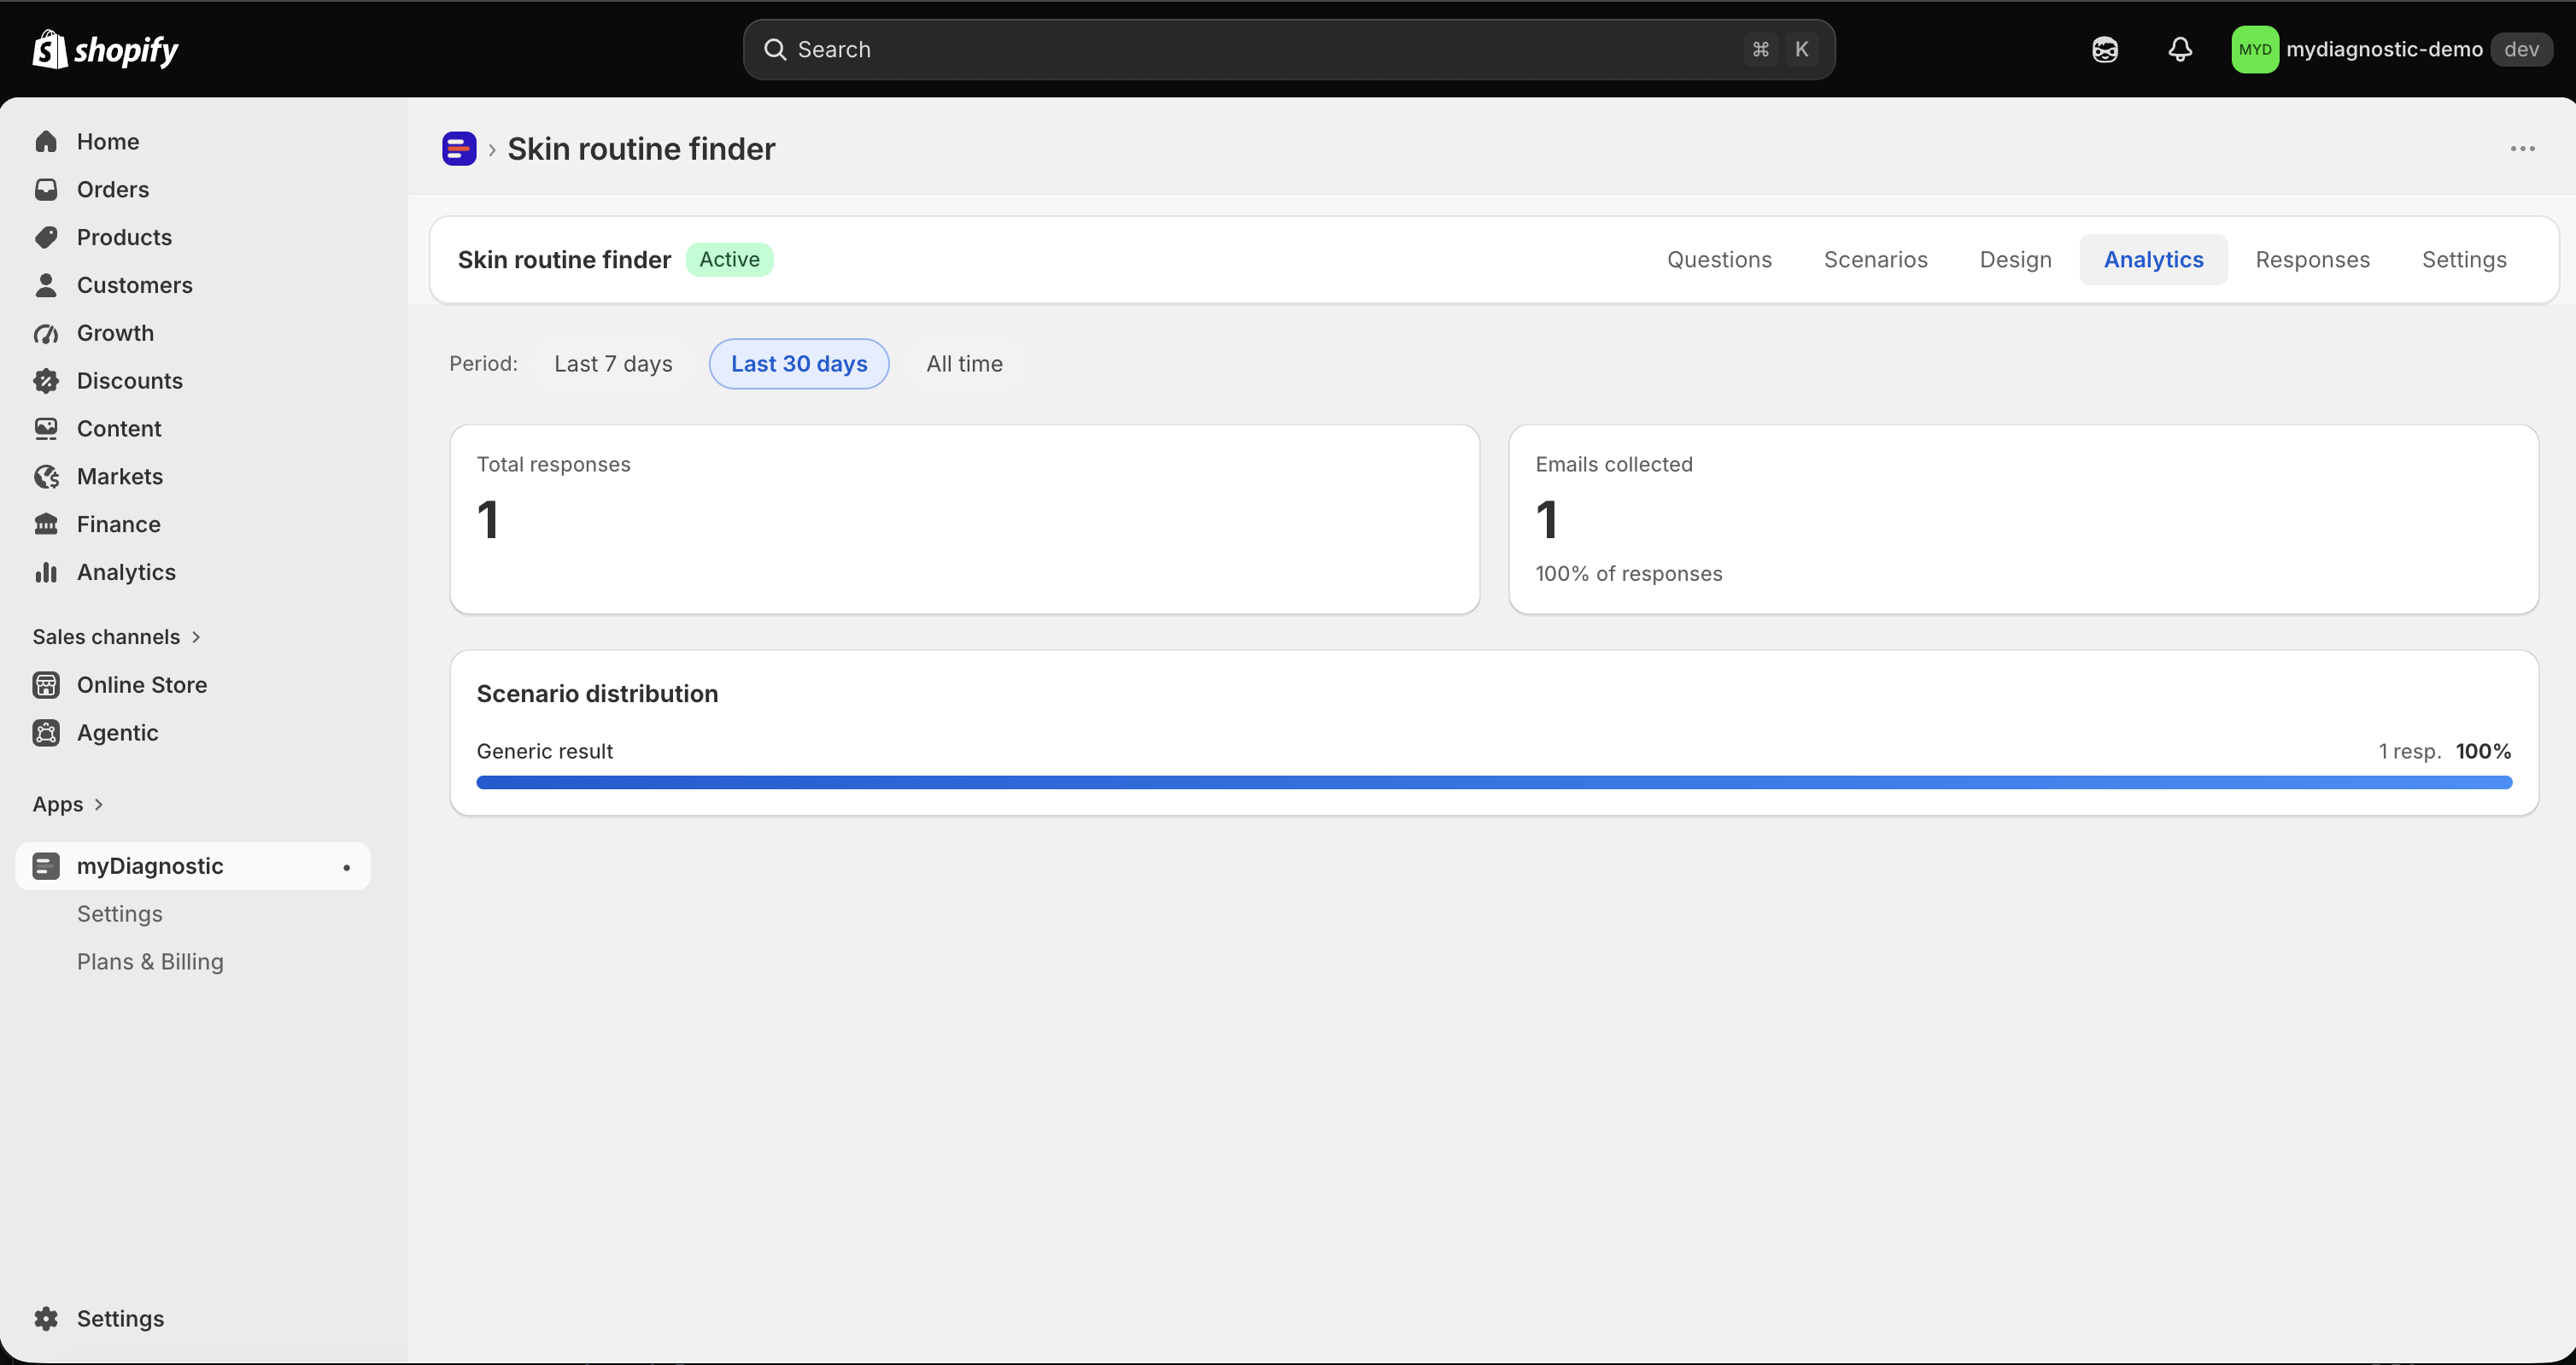
The tab holds three things: the period filter, two figures side by side, and the Scenario distribution card under them. Nothing on it is editable, and reading it changes nothing in the quiz.
Choose the period
A line reading Period: sits above the figures, followed by three choices. Last 30 days is selected when you arrive.
- Last 7 days
- Last 30 days
- All time
The first two count backwards from the moment you open the page, so they are rolling windows rather than calendar months. Last 30 days on 20 March covers 18 February to 20 March, and it will not match the monthly usage figure on Plans & Billing, which resets on the first of each month.
Your choice drives the whole tab at once: both figures and every row of the distribution are counted over the same window. It is not remembered. Leaving the tab and coming back starts on Last 30 days again.
The two figures
Total responses is the number of customers who finished the quiz during the period.
Emails collected is how many of those responses carry an email address, and the line under it gives the share, for example 62% of responses. An address counts here whether the customer typed it into the email gate or into an Email capture field on the welcome screen, see Email gate. The share is rounded to the nearest whole number.
What counts as a response
A response is written at the end of the run, at the moment the result is about to appear on screen. Everything the customer did before that point leaves no trace, which decides most of what these figures mean.
- A customer who abandons at a question is not counted anywhere.
- With the email gate switched on, the gate stands between the last question and the result, so a customer who closes the page rather than giving an address is not counted either. Total responses is then the number of people who went through the gate.
- With the gate switched off, the result follows the last question directly, and the response is recorded there.
- Reopening a result later through its permalink shows the stored result and adds nothing, see Permalink.
- When the answers return no product at all, because the products an answer voted for were deleted from the store, the customer gets the unavailability message instead of a result and nothing is recorded.
- Once your monthly response allowance is used up, the customers who finish after that get the same unavailability message, and they are not recorded. Fifty responses per month on the Free plan, counted for the whole store rather than per quiz, see Plans and quotas.
The scenario distribution
The Scenario distribution card breaks the same responses down by the result each customer landed on. One row per result, ordered from the most frequent down, each carrying its title, the number of responses followed by resp., the share of the period total as a percentage, and a bar drawn to that percentage.
A scenario with no response in the period has no row at all. Widen the period to bring it back.
The result is recorded, not recalculated
The scenario a customer saw is stored with their response, at the moment they saw it. It is never worked out again afterwards. Change the products of a scenario, change the weights behind an answer, add a question, and past responses stay in the row they were filed under. Only new responses follow the new setup, which is what lets you compare a period before a change with a period after it.
Two edits do reach the rows already there:
- Renaming a scenario renames its row, including for the responses recorded under the old name. The card reads the title live, so it always shows the scenario as it is named today.
- Deleting a scenario does not delete its responses. They keep counting in Total responses, and they move into the Generic result row, since the result they were given no longer exists.
The Generic result row
Generic result is the row for every response whose three winning products matched no scenario. Those customers still got a result, with the same product cards and none of the editorial writing a scenario adds, see Result scenarios.
A large Generic result share is worth acting on: it says most of your customers reach a trio you have written nothing for. On the Free plan, where scenarios are not available, it is the only row the card can ever show.
When there is nothing to show
When the period holds no response, the Scenario distribution card carries a message in place of the bars. The two figures above it stay on screen and read 0.
On a published quiz the message is titled No responses in this period and reads Analytics fill in as customers complete this quiz on your storefront. Try a longer period, or take the quiz yourself to generate a first response., with an Open your store button next to it. Taking the quiz yourself does record a real response, which then counts in these figures and against your monthly allowance like any other.
On a draft quiz the message is titled No responses yet and reads This quiz is still a draft: publish it and place the theme block to start collecting responses., with an Open quiz Settings button. A draft quiz serves nothing on the storefront, so it can hold no response until you publish it and place the block, see Add the theme block.
Exporting is done on the Responses tab
There is no export on Analytics. The responses themselves, one by one, and the Export CSV button that downloads them live on the Responses tab of the same quiz, immediately to the right of Analytics in the row of tabs.
The file holds one row per response, with the date, the name, the email address, the age, the scenario, the recommended products and the link to the customer's result page. A response that matched no scenario carries Generic result in its scenario column, exactly as on this tab. The export always covers every response the quiz ever collected: the period you selected on Analytics has no effect on it.
Figures from long ago
Responses are anonymised automatically once they are 24 months old. The name, the email address, the age, the language and the detailed answers are cleared, and the response itself is kept, with its quiz, its scenario and its recommended products. Total responses and the distribution therefore keep their full history, while Emails collected drops the addresses that aged out. See Data and privacy.
The plan you need
The Analytics tab, its two figures and the scenario distribution are available on every plan, Free included.
One thing on it depends on your plan. Scenarios need the Basic plan or above, so a quiz on Free has none to show, and its distribution is a single Generic result row holding every response.
See Plans and quotas for what else each plan carries.